N.B. : Substantial material from this portion relies to a point that is just short (I hope) of plagiarism from an excellent article by Bruce Sterling on the history of the Internet
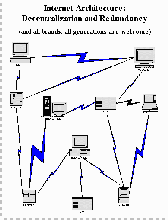
The story of the Internet begins over thirty years ago, at the height of the cold war. The U.S. military gave a difficult assignment to the RAND Corporation, the think tank that specializes in "thinking the unthinkable" - they prepare plans for fighting and surviving a nuclear conflict.
The generals wanted a design for a communications system that could survive a nuclear attack. The first spec was that any point in the network that took a hit must be assumed lost - there is simply no defence against nuclear weapons. So any central authority, any major control point, would be an obvious first target. All nuclear war plans are statistical - they assume that you will lose some assets, but also keep some if you can take out enough of the enemy before they launch. But if your enemy need only hit a few key points to destroy one of your systems, it will have no statistical chance of surviving an attack that is even partially successful.
A RAND staffer named Paul Baran is credited with a daring solution which was first made public in 1964. He came up with a communications system design that defied all the usual military principles by having no central control whatsoever. Further, it assumed its own unreliability at all times; it was designed to keep operating while in tatters, and while losing pieces of itself as it worked.
(Graphic 1 - Internet Architecture)
Menu of downloads
(Graphic 2 - Internet Protocol)
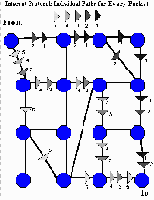
By contrast, a phone call opens a particular circuit right from origin to destination for the whole message. If any part of the network along the way were lost, you would have to start the whole call over. The phone system is much more efficient - but the packet-switched network is much more rugged.
Understand that for years this was all just an idea on paper and through the 60's it was only a series of lab experiments at MIT, UCLA, and the National Physical Laboratory in Britain. It was the Defense Advance Research Projects Agency, "ARPA", that put forward a project that would justify the expense for a full-scale test. The ARPAnet would link together computers at different academic and research sites to share resources, pass information, and thereby save some money. It was two years of design work before they had taken their ideas far enough to go to a request for proposals to build equipment. The critical element was, and is, called the Interface Message Processor, or IMP -a computer that did nothing but route packets from one link to another, automatically. IBM, claiming that such a network could never be built, declined to bid. Small companies did accept the challenge, and the first node went into testing over the Labour Day weekend in 1969, barely a year later. By December, four were in service and with 1970, twenty-five years of geometric expansion began.
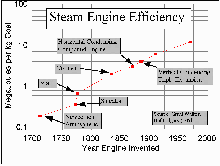
(Graphic 3 - Steam Engine Efficiency)
Menu of downloads
So exponential improvement in technology is not unique to this century. This graph makes clear that generations of steam engineers each saw major changes during the course of their careers. I read to you from the poem "McAndrew's Hymn", written in 1893 by Rudyard Kipling, the thoughts of a retiring ship's engineer:
...the auld Fleet Engineer
That started as a boiler-whelp - when steam and he were low,
I mind the time we used to fix a broken pipe with towel!
Ten pound was all the pressure then - Eh! Eh! - a man would drive;
An' here, our workin' guages give one hunder sixty-five!
We're creepin' on wi' each new rig - less weight an' larger power;
There'll be the loco-boiler next an' thirty mile and hour!
Thirty an' more. What I ha' seen since ocean-steam began
Leaves me no doubt for the machine; but what about the man?
But geometric increase in technology is mentioned most often today in reference to this little engine.
(Graphic 4 - Moore's Law)
Sorry, can't supply this in the published version: the material
is copyrighted. Check out page 90 of the February, 1995 issue
of "Scientific American". It shows a graphic that looks like
an archery target.
This is the first transistor printed on silicon, circa 1959. It was the huge, clumsy size of three-quarters of a millimeter across - so ungainly it could actually be seen with the naked eye. Development of these has quite faithfully followed Moore's Law, coined by Gordon Moore, co-founder of the Intel corporation that makes the chips found in most PC's. It says that the elements per chip will double every 18 months after 1959. The 36 years since 1959 have now brought 24 of these generations - and sure enough, 16 million-bit memory chips, using one transistor per bit, are commonplace in 1995. The February, 1995, article in Scientific American, from which I take this picture, was on the subject of how long Moore's Law can hold. While the physicists think that several more generations are possible before quantum effects begin to ruin the transistor's behaviour, we will start running into real manufacturing difficulty after the billion-bit chips come sometime around the turn of the century. Even if Moore's Law does slow down or even stop at that size, it will still give us machines capable of, say, manipulating full-length movies in RAM memory, in stores for Christmas 2005.
As Moore's Law has provided machines that can do more things, the market for them has expanded geometrically as well - and provided the Internet with an expanding environment to grow in.
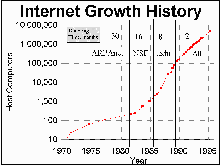
(Graphic 5 - Internet Growth History)
Menu of downloads
Until about 1982, it was just the ARPAnet, really only used for research into computers and communications. It grew more slowly at first, only doubling every two or three years. Then, in 1983, all the military sites split off to form MILnet - they were finding it so useful that they were beginning to use it for operational work, and they wanted to limit their links with non-military sites for security reasons. Less than a year later, the National Science Foundation began funding a series of improvements to the major "backbone" links between the larger nodes. The Net was being used for all sorts of academic and research topics now, right down to the grad-student level, and growth began to take off, doubling every 16 months or so.
This brought in interested joiners from other government agencies and countries. There was a short era where growth exploded to doublings every 8 months or less, with networks from NASA, the National Institutes of Health, the Department of Energy. Now the old ARPAnet was just one member network of the "network of networks" that was now being called the Internet. I call this the ".edu" era as that is the name on the end of all educational sites. During this period, basically every University on the continent joined up and a fair proportion of those abroad. Over 1987, the total computer hosts jumped from 5,800 to 28,000. At the start of the academic year in fall 1988, it went from 33,000 to 56,000 in 3 months.
With the entire educational and US government computing niche filled by 1989, growth has actually slowed since to a steady doubling about every year for the last six. Recently, the sites that end in ".com" for "commercial" have outnumbered the ".edu"s. Over the next two or three years of doubling it should reach the point where every business, even the smallest, has some Internet access, where most home computer owners have an Internet account, and most of the high schools and even elementary schools as well. The rough expectation is that growth will not slow until the end of the decade, at around 100 million host machines, and perhaps 300 million people. For business at least, the Internet has now reached the point that FAX machines did around 1990 - suddenly, a business can't afford NOT to have one.
The businessmen are responding to another law, dubbed Metcalfe's Law after Bob Metcalfe, inventor of the "Ethernet" networking scheme that is still the dominant one in office networks. (This is my last equation, I promise.) It says that the usefulness of any network is roughly proportional to the square of the number of nodes upon it. The railroad, the Interstate Highway System, the telephone, and the FAX have all seen the same phenomenon: suddenly, they reach the "elbow" in that parabolic "usefulness" curve, and everybody has to be on it.
A recent article in the Economist magazine pointed out that the Internet, as a computer network, is the first one in history to benefit from both laws at once. Let's just review it: over the next five years, the new computers being connected to the Internet will double in speed and capacity every year and a half; the Net itself will double in size every year; and its value to society will increase as the square of all that. I know that sounds like an arm-wave; a moment with the back of an envelope translates that to a claim that in five years the Internet will be a thousand times as useful as it is today - which sounds absurd.
Yet remember that for all the hype, today only 5-10% of Calgary households use the Internet at all, and those mostly for casual interest and amusement. And Calgary is, per capita, perhaps the heaviest computer-using city in Canada, perhaps even the continent. Internet use, in, say, rural Nova Scotia would be under 1%. Many parts of Europe have no connections yet except to Universities, just like Calgary of five years ago.
So the claim is basically that most people will have some access to a computer and that almost all of them will be connected at least to the extent of sending each other E-mail; and E-mail alone is reason enough to join up. It gives long-distance communication at one flat rate per year.
The Internet is flat-rate on all messaging because it uses the same principle as the International Postal Union; everybody agrees to pass on everybody else's messages. To put your own site on the Internet, you have to lease one or more lines. Sometimes other people's packets pass through your line; sometimes they return you the same favour. (This of course doesn't apply to home users; your Internet provider's line lease is incorporated in your $10/month fee.) Some people think this will break down at some point, but so far, it seems to be working well enough.
(Graphic 7 - Internet hiccup story)
Sorry, can't supply this, it is also copyrighted material. See
the front page of "Computerworld", September 13,1995, and the
story "Internet Hiccup"
That claimed, nobody disputes that there have been growing pains. This story from last month's Computerworld tells of a "bandwidth brownout" on the Internet. It wasn't actually caused by simple overcrowding - there was a complicated glitch with a single message broadcast to all sites - but the severity of the problem was made much worse by the level of traffic. One reason computer people continue to stay up late, even though you no longer have to do so to have the computer all to yourself is how much the Internet bandwidth improves in the wee hours - the transportation engineers out there would call it the difference between Level-of-Service D and Level-of-Service B. File transfers that took several minutes begin to take a few, or one. The sub-head on the story mentions "a more robust backbone".
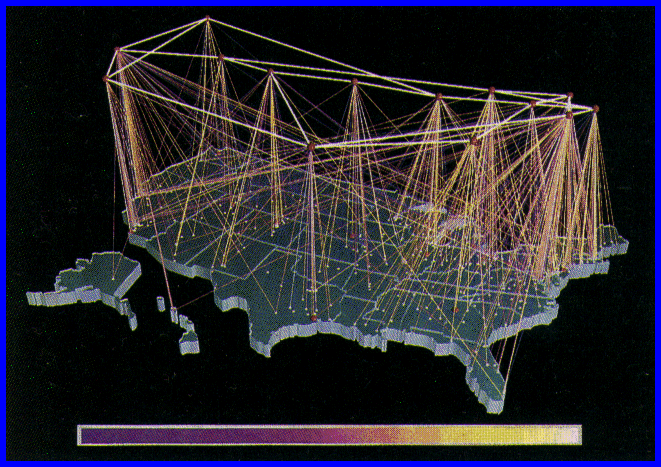 (Graphic 8 - NSF network picture)
This classic picture was prepared by the National Science Foundation
to show the backbone lines that they have sponsored. While any
Internet connection can theoretically carry any message, most load is
passed through a small number of very fast phone lines, which in the
graphic are in white, lifted up above the continent. The smaller
lines from those major nodes to the minor ones are the tree of orange
lines from those down to the ground. Don't miss, however, that there
are lines from major nodes to minor nodes clear across the continent,
such as one from the mid-west to Miami, or from the northeast to L.A.
Also, the graphic doesn't show the huge number of small lines running
from small nodes to other small nodes. The Internet can lose one or
more of these fast backbone lines and traffic is just routed through
the alternate routes - but that does mean a major traffic slowdown
that causes most users to quit using it for a while, so that only the
most urgent needs are filled.
Some users say that the Net is bad all the time - they complain that it takes minutes to download a small graphic, and many seconds for even a page of text. I'm sorry, but I think they're spoiled. It was very recently that the only way to get a page of text to the next town was to mail it or drive it yourself, which would be days. Now they complain because the Net is only four times as fast as thirty seconds per page on a FAX machine.
The Internet is an almost frighteningly cheap way to send mail - literally a few pennies per message if you send a dozen a day. And it doesn't matter whether they are sent to downtown or to Singapore. Flat rate.
James Burke, in "The Day the Universe Changed", estimated that the printing press caused the price of a book to fall by some 400-fold as they became common; the Net could do as much again for distribution of some kinds of information.